Laboratory Exercise 7
CSCI 127: Introduction to Computer Science
Hunter College, City University of New York
Spring 2025
Learning Objectives:
- Students will obtain and analyze NYC OpenData.
- Students will use Python's zips to combine data.
- Students will write Python functions.
- Students will explore stand-alone program vs. modules.
- Students will execute Python from the Command Line Interface.
Software tools needed: terminal (command line), web browser and Python programming environment with numpy and matplotlib packages installed.
1. Using NYC OpenData
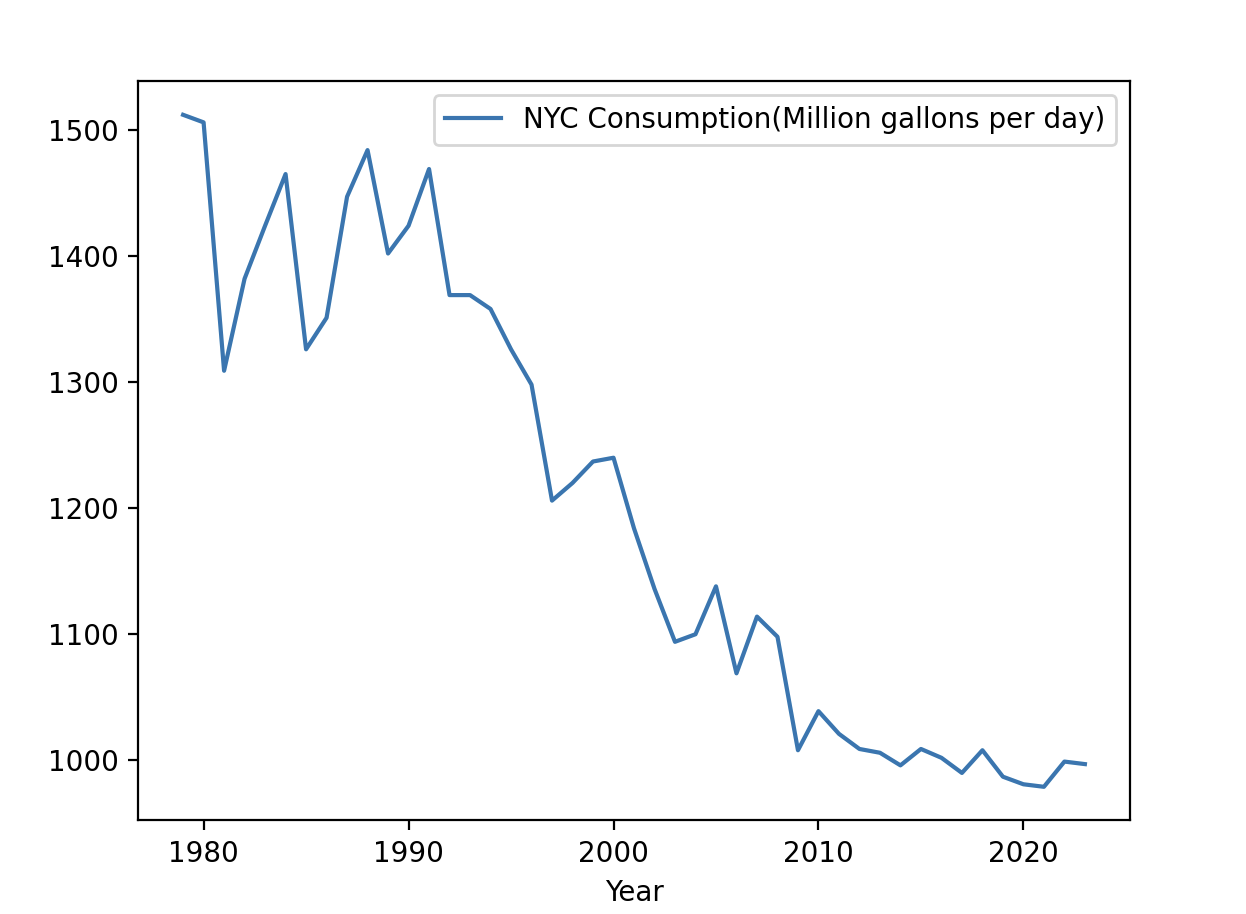
Via the NYC Open Data project, you can access data from almost every city agency. Let's use pandas (introduced in lecture and Lab 6) to plot some data from NYC OpenData. Below is a graph of the water consumption in NYC since 1979:
We'll start by downloading the data which can be found here
Click on the EXPORT button on the top right of your screen.
- Select the "Download file" option and make sure the "Export Format" dropdown is set to CSV. Press the "Download" button
- The download will begin automatically (files are usually stored in "Downloads" folder)
- Your file will be downloaded with a default filename, feel free to rename the file so it is easier to reference in your program.
Move your CSV file to the directory that you save your programs. Open with a plain text editor if you would like to see the raw data. Make sure you keep the file extension as .csv as we don't want any extra formatting in the file. Look at the names of the columns since those will correspond to series we can plot.
Now, we can write a (short) program to display daily counts:
import pandas as pd
import matplotlib.pyplot as plt

df = pd.read_csv("water_consumption.csv")

df.plot(x = "Year", y = "NYC Consumption(Million gallons per day)")
plt.show()Challenges
- What happens if you leave off the y = "NYC Consumption(Million gallons per day)"?
- How can you save your plot as an image file? (Hint: See Lab 6.)
Binning Data: Parking Tickets
we will look at the parking tickets issues by New York City. We will use a small version (1000 lines) for today's lab (see below). But you are welcome to use any neighborhood in the city. To download data for a given neighborhood (and restricted to just fiscal year 2018, since the data sets can be quite large):
- Instead of neighborhood name or zipcode, parking tickets are classified by the police precinct that issued the ticket. First, figure out the precinct (here's a useful tool).
- Fiscal year 2018 (FY2018) parking tickets for your precinct: download the data set as a CSV, filtering by "Violation Precinct". For example, Hunter College is located in the 19th Precinct, so, you would enter 19 on the filter.
The data file you downloaded is in CSV format which stores tabular information in readable text files. The files have information separated by commas (using tabs as delimiters is also common). Here is a sample line:
1335632335,L040HZ,FL,PAS,06/09/2015,46,SUBN,NISSA,X,35430,14510,15710,0,0020,20,74,921167,E074,0000,1213P,1207P,NY,O,4,WEST 83 ST,,0,408,C,,BBBBBBB,ALL,ALL,RED,0,0,-,0,,,,,All lines are formatted similarly: they start with the summons number, then the license plate, registration state, plate Type, date, and continue with the information about the location and type of violation, and sometimes additional information such as the who issued the ticket and the color of the car. The first line of the file gives the entries in the order they occur in the rows.
The sample entry above gives details for a ticket issues on June 9, 2015 to a passenger car with Florida plates, L040HZ. The red Nissan SUV received the ticket on West 83rd Street. Each entry also begins with a unique identifier that can be used to look up the parking ticket.
Since there were over 196,000 tickets for the FY 2016 for the 20th precinct, here is truncated version of that data, containing just the first 1000 lines: tickets.csv.
Here are some questions we can ask about the data:
- Which car got the most tickets?
- What color of car is most likely to get a ticket?
- What type of license gets the most tickets?
- Which location yields the most tickets?
For each of these questions, we can traverse the file and count the occurrences as we go.
Counting Tickets per Car
A simple, but very powerful, technique is "binning data"-- that is grouping data into the number of occurrences for each categories that we saw in Lab 6. The category values can often show patterns that individual data points do not. For example, binning population by zipcode can show patterns in density that's difficult to see with individual data points. Below, we will bin parking tickets by different attributes.
How can tell which car got the most tickets? First, we need to figure out a unique way to identify different cars. Luckily, cars almost always have license plates-- with each state having a unique number. (For this simple exercise, we'll assume that each license plate is unique on its own-- not an unreasonable assumption since every state has a different schema for assigning numbers, but to be more accurate we should keep track of license plate number and issuing state.)
Open up the CSV file and look at the columns. Which column contains the license plate number? Here's all the column names (first line of tickets.csv):
Summons Number,Plate ID,Registration State,Plate Type,Issue Date,Violation Code,Vehicle Body Type,Vehicle Make,Issuing Agency,Street Code1,Street Code2,Street Code3,Vehicle Expiration Date,Violation Location,Violation Precinct,Issuer Precinct,Issuer Code,Issuer Command,Issuer Squad,Violation Time,Time First Observed,Violation County,Violation In Front Of Or Opposite,House Number,Street Name,Intersecting Street,Date First Observed,Law Section,Sub Division,Violation Legal Code,Days Parking In Effect ,From Hours In Effect,To Hours In Effect,Vehicle Color,Unregistered Vehicle?,Vehicle Year,Meter Number,Feet From Curb,Violation Post Code,Violation Description,No Standing or Stopping Violation,Hydrant Violation,Double Parking ViolationLet's use Pandas to read in the CSV file, following the same pattern as last lab:
"""
Count which cars got the most parking tickets
"""
#Import pandas for reading and analyzing CSV data:
import pandas as pd

csvFile = "tickets.csv"			#Name of the CSV file
tickets = pd.read_csv(csvFile)		#Read in the file to a dataframe
print(tickets) 				#Print out the dataframe
Try running your program. It should print out all the information about all the tickets issued. Let's focus in on just licence plates. Change the last line of your program to be:
print(tickets["Plate ID"]) #Print out licence platesWhen you run the program again, you should just see the row number and licence plate recorded for each row.
We want to refine this further to print how many tickets each car got. Pandas has a function just for counting occurrences, called value_counts(). Let's modify our last line again to use it:
print(tickets["Plate ID"].value_counts()) #Print out plates & number of tickets each gotRerunning the program, there are a lot of cars that got only a single ticket. If you scroll back up the Python shell, you will see the cars with the most tickets are listed first. Let's just print out the 10 cars that got the most tickets. We can do this by slicing to [:10]:
print(tickets["Plate ID"].value_counts()[:10]) #Print 10 worst & number of ticketsEven with only 1000 lines of ticket information, there is a car (with plate TOPHAT5) that got more than 5 tickets.
Let's make our program a bit more general, to allow the user to enter their own file name:
"""
Count which cars got the most parking tickets
"""
#Import pandas for reading and analyzing CSV data:
import pandas as pd

csvFile = input('Enter CSV file name: ')        #Name of the CSV file
tickets = pd.read_csv(csvFile)                  #Read in the file to a dataframe
print("The 10 worst offenders are:")
print(tickets["Plate ID"].value_counts()[:10])  #Print 10 worst & number of tickets
When you run it on the tickets.csv, you should see output:
Enter CSV file name: tickets.csv
The 10 worst offenders are:
Plate ID
TOPHAT5    6
GXP4564    4
XBLD33     4
T63FNW     4
XANK43     3
R12FGF     3
TOPHAT9    3
XP627S     3
GN8063     3
ZDH5639    3
Name: count, dtype: int64
Binning Other Data
Now that you have a program to use as a basic template, answer the following questions:
- What color of car is most likely to get a ticket?
- What type of license gets the most tickets?
- Which location yields the most tickets?
2. Python's zips
At the operating system level, there are several apps that will pack or "zip" all of your files into a single files. In Python, there's a similar function, zip() that takes lists and pairs or "zips" them together. For example:
firsts = ["Thomas", "Jennifer", "Anne", "Nancy"]
lasts = ["Hunter", "Raab", "Kirshner", "Cantor"]

names = zip(firsts,lasts)
print(names)
for f,l in names:
    print(f,l)
The code will create a lists of names, paired together. When you try to print a zip object, it will give you the address, which isn't very useful. Instead, you can use the zip object to loop through the two lists paired together.
Step through the examples below, trying to guess what each line does, before you execute the line:
More examples can be found in the Python documentation.
3. Functions in Python
Python allows you to write programs as scripts: basically, a list of commands that are executed one after the other. You can also organize the programs in functions, which groups commands together that can be reused. Many programming languages (like C++ or Java) require that your programs be organized in functions.
To define function in Python, we use the def command, which has the basic form:
def myFunction(input1, input2, ...):
    command1
    command2
    ...
Note that everything indented below the def line is considered part of the function. When you type the function name (followed by parenthesis), it calls (or "invokes") the function, which means it executes all the commands, one after another, that are part of the function.
Work through Section 6.1: Functions of the textbook, including the check-your-understanding questions at the end:
4. Stand-Alone Programs vs. Modules
In Python, we have the option of running our programs as a standalone program, or included as module as part of another program. Since it's common to do either, we can write that into our programs.
Let's rewrite our first program, using functions. By tradition (and since it matches the naming protoccol of C & C++), we will call our function main() (see Section 6.8: Using a Main Function):
"""
Name:  your name here
Email: your email here
This program, uses functions, says hello to the world!
"""

def main():
    print("Hello, World!")

if __name__ == "__main__":
main()Save your program and try running it in IDLE.
Now, at the prompt (the window with the lines beginning with >>>), type main(). This calls the function directly. Note that calling the function either way results in the same actions: the commands inside main() are executed.
When you have a running version, see the Programming Problem List.
5. Using Python from the Command Line Interface
In addition to IDLE (and other development environments with graphical interfaces), Python can also be used directly from the command line. In fact, this is what the grading scripts do to evaluate your programs, since Gradescope uses a remote cloud server and does not have a graphics window.
To start, we need a command line interface (aka a terminal window). To launch the terminal, click on the terminal window icon in the left menu, or go to search option in the upper left corner and type and then open terminal.
In Lab 1, we launched IDLE from the terminal by typing:
$ idle3We can use Python in a similar fashion. In a terminal window, change directories to where you stored your hello program above (see Lab 4 for changing directories at the command line).
Let's run your hello program from the command line. If your program is called hello.py, you would type at the command line:
$ python3 hello.pyWhat's Next?
You can start working on this week's programming assignments. The Programming Problem List has problem descriptions, suggested reading, and due dates next to each problem. You should aim to finish the programs in the next week, although the deadlines are several weeks out, to give a buffer just in case.