Submit the following assignments via the honors section of Gradescope:
- HC 1: Team Contract and Dataset (NYC Clean Heat or another dataset of your choice) Due Date: 30 August

Throughout the semester, we will analyze the NYC Clean Heat Dataset. Provided by the Mayor's Office of Climate and Sustainability as part of the NYC Clean Heat program, an initiative in New York City aimed at improving air quality and reducing greenhouse gas emissions by encouraging building owners to switch from using heavy heating oils, such as No. 4 and No. 6 oils, to cleaner and more efficient heating sources.
Step 1 -- Project structure:
You will work in teams. Each team will be assigned a borough to analyze and each team member will choose a neighborhood within that borough.
Throughout the semester each team will provide different analyses of their assigned borough and chosen neighborhoods.
These analyses will be broken down across different assignments and will be summarized at the end of the semester in a showcase project presentation.We propose that you use the NYC Clean Heat Dataset. However, we give you the freedom to choose a different dataset if that would inspire you more. A great place to look for data is NYC Open Data. If you choose a different dataset, it must have the following properties to guarantee that you will be able to fulfill all the assignments despite working with different data:
- The data must have an attribute (column) corresponding to neighborhoods (preferably NYC)
- It must include some numerical data
- It must include some categorical data
- It must include geographical locations (latitude and longitude columns, or exact address column)
Discuss with your assigned team to decide on a dataset, then move on to Step 2.
Note: You don't need to identify the alternate dataset in this assignment, but if you are considering it you should indicate so in Step 2 and must identify the dataset no later than our next meeting on September 2.Step 2 -- Team Contract:
Work with your assigned team to complete the Team Contract.
Once your contract is complete and signed by all team members, upload a .pdf to the assignment HC1 in the honors section of Gradescope. This will be a group submission (one submission per team). Unlike the Python code, it is not automatically graded.
- HC 2: Borough Analysis
Due Date: 6 September
To begin, discuss with your team to pick a neighborhood in your team's borough (a different neighborhood for each team member). Keep in mind that you want all the neighborhoods together to be representative of the borough. You also want to be sure your neighborhood is well represented in the dataset.
Create a single page summary of your neighborhood that includes at least the following:
- Name of the neighborhood (include in the title),
- The zip code(s) of your neighborhood,
- A map of New York City with your neighborhood highlighted,
- A photo or image that captures your neighborhood and
- The demographics of your neighborhood.
A great resource for your analysis is Social Explorer. Note: you don't need to necessarily create an account. From the top menu, select Resources - Demographic Profiles and enter the zip code(s) of your neighborhood to find a wealth of information.Individual submission: Submit a .pdf file containing your summary.
- HC 3: NYC Clean Heat program
Due Date: 13 September
Research the NYC Clean Heat program to answer the following questions about the data:
- What is the NYC Clean Heat program?
- What are No. 4 and No. 6 fuels?
- What is the DEP Boiler Registration and what is it meant to monitor?
- What is the Greaner Greater Buildings plan?
- How can buildings convert to clean heating fuels?
Grading criteria:
- Group gathers and reports on facts and data to answer the above questions.
- Group cites sources in support of their findings.
You can share a Google Doc or you can use a collaboration tool for this project like Miro or Padlet. Both have a free plan option that should be enough for the purpose of this project.
Group submission: Submit a single .pdf summarizing your findings and cite your sources. Write a full report in essay form, not a disconnected list of answers to be above questions. This will be a group submission (one submission per team).
- HC 4: NYC Emissions
Due Date: 20 September
The vast majority of NYC’s greenhouse gas emissions come from our buildings. Many buildings rely on fossil fuels for heating, cooling, and cooking, and have energy inefficient appliances or windows that cause higher emissions.
With your group, browse the web to gather data on this topic.Grading criteria:
- Group gathers and reports on facts and data about emissions in NYC as well as data specific to their borough.
- Group cites sources in support of their findings.
You can share a Google Doc or you can use a collaboration tool for this project like Miro or Padlet. Both have a free plan option that should be enough for the purpose of this project.
Group submission: Submit a single .pdf summarizing your findings and cite your sources. This is a group submission (one submission per team).
- HC 5: Discussion
Due Date: 29 September IN LAB
In this meeting we will discuss your findings from HC 2, HC 3 and HC 4. Each team will summarize the overall discussion of the borough and how that relates to the individual neighborhoods.
No submission necessary. This assignment will be graded based on your group's contribution to the discussion.
Grading criteria:- Group summarizes their findings from HC2.
- Group summarizes their findings from HC3.
- Group summarizes their findings from HC4.
- Group provides satisfactory summary in 5 minutes. Please coordinate with your group to do some preliminary planning for your presentation.
- HC 6: Highlighted Map
Due Date: 4 October


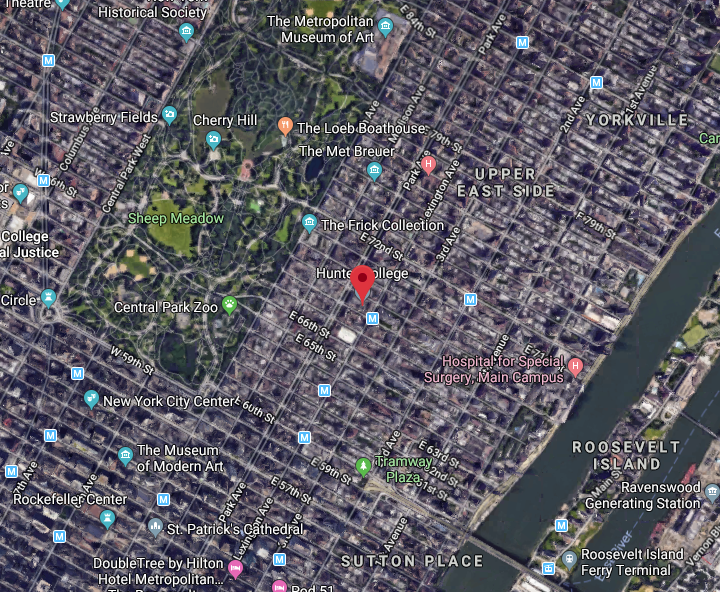
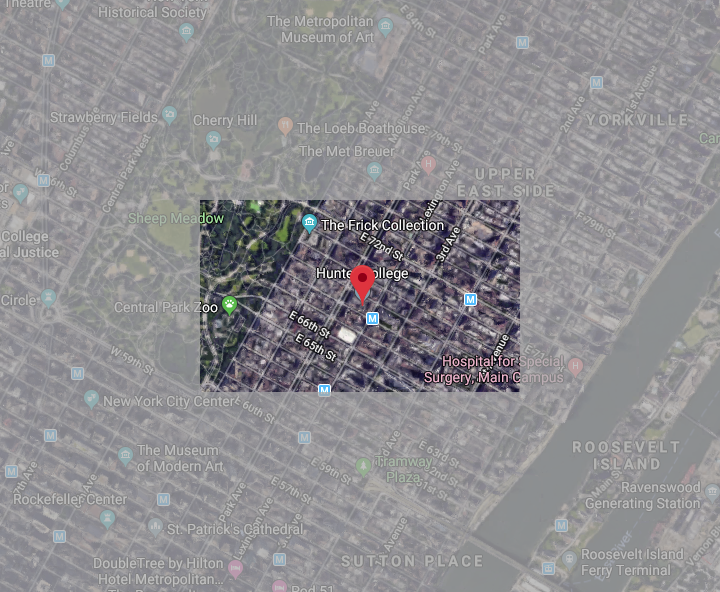
For this program, we will create a highlighted map centered around your neighborhood, with a boxed region around a marker at the center of the neighborhood at full brightness, the region outside that box at 50% brightness.
To do this:
- Create a .png file of a satellite map, centered on your neighborhood (Google maps works well for this, but you can use any mapping site to create your base map).
- Write a Python program that reads in an image and saves the image to another file. Run your program to make sure the reading and saving of an image works.
- Set the upper region of the image to 50% brightness (hint: uses slices and see example in Lecture 3 and 4). Run your program to make sure it has dimmed up the upper region and adjust to get the correct dimenssions.
- Set the lower region of the image to 50% brightness (hint: think about what negative numbers mean as indices). Run your program and fix any bugs.
- Next, dim the side regions (hint: think about what parts of the image have not been dimmed and change only those regions.)
Individual submission: Submit your answer as a .pdf file (both code and image) to Gradescope.
- No HC Assignment due the week after Friday Oct 6 (out of synch with lecture content)
Due Date: 13 October: IN LAB
- HC7: Data Exploration
Due Date: 20 October: IN LAB
For this assignment, we will analyze our dataset clean_heat_dataset.csv. This assignment will span over the course of two weeks (two meetings).
During the first meeting, on 13 October, look over this data-exploration document, it will illustrate how to explore, clean and visualize the data.
This is an interactive computational environment (an Jupyter, a.k.a. ipython, notebook hosted in Google Colab). To execute each cell, one at a time, click on the play button or, with the cell highlighted, press Shift+Enter on your keyboard. The order in which you execute the cells matters. Start at the top, and work your way down the notebook, discuss it and make sure you understand it. Then make a plan together about what you will look for in the data and how.Come to our next meeting meeting, on 20 October, with a clear plan, perhaps even a working-in-progress program (this is not a typo, it means a working program even if not final) and you will work as a team to refine your plan ( or your program) and produce the group analysis for the borough combining your ideas.
You will discuss your plan during the next meeting.
There are two parts to this analysis:
- Group analysis of the borough and how it compares to others
- Add some analysis of your individual neighborhoods
Grading Criteria:
- Analyzes the data to provide statistics for the neighborhood/borough and discusses these observations in writing within the notebook. If you observe anything that seems anomalous don't hesitate to report so, data is never perfect! (meets: 2, exceeds:3)
- Makes observations that go further what may be simply observed by using the describe() function. (meets:2, exceeds: 3)
- Provides and discusses visualization for the data observed (at least 3 different kinds of plots and at least 6 plots total, more is better). These can be any type of plot, use what makes sense for your observations. Play and have fun with the data!!! Include the images and don't forget to discuss them!!! (meets:2, exceeds: 4)
- Extra Credit: Makes a connection between data analysis and observations made in HC2/HC3/HC4, in a paragraph and visually supported with plot(s). (5 points)
- HC8 Finalize Data Analysis
Due Date: 25 October
During our meeting on October 20, discuss your analysis with your teammates, and decide on a plan for the group neighborhood analysis, keeping in mind the grading criteria below as a guide.
Make a plan on how to split the work for the group analyisis and how you will consolidate it into a unique submission.
There will be one submission for each group, including:
- Group analysis of the borough and how it compares to others
- Some analysis of the individual neighborhoods
Grading Criteria (same for both submissions):
- Analyzes the data to provide statistics for the neighborhood/borough and discusses these observations in writing. If you observe anything that seems anomalous don't hesitate to report so, data is never perfect! (meets: 2, exceeds:3)
- Makes observations that go further what may be simply observed by using the describe() function. (meets:2, exceeds: 3)
- Provides and discusses visualization for the data observed (at least 3 plots, more is better). These can be any type of plot, use what makes sense for your observations. Play and have fun with the data!!! Include the images and don't forget to discuss them!!! (meets:2, exceeds: 4)
- Extra Credit: Makes a connection between data analysis and observations made in HC2/HC3, in a paragraph and visually supported with plot(s). (5 points)
What to submit:
If you use Google Colab, you can print/save as pdf. and submit. Make sure every result (statistics and plots) is supported by a paragraph describing it. The paragraph should not only describe what you are doing (the code), but most importantly what you observe.Group submission: Submit a single .pdf summarizing your findings and cite your sources. This is a group submission (one submission per team).
In class on October 27 each team will briefly present their data analysis and other teams will provide feedback.
Each team will then resubmit a revised data analysis that addresses the feedback.
Using folium, generate an html map with markers for boilers/buildings in your neighborhood.
To do so:
- Create a neighborhood dataframe by selecting only the rows for your neighborhood
- Create a map object
- Loop for each row in the neighborhood dataframe to
- create a marker for that latitude and longitude
- add the marker to the map
- Save the map to an html file
Hint: You can mirror the program in Lab9 that creates a map with markers for CUNY campuses.
Note: If your neighborhood has too many entries and the map is excessively crowded, you can select a random subset. Don't remove too many, however, so that the map remains representative of the data.
Individual submission: Submit a screenshot of your map and your code as a single .pdf file.
We are going to use github to make webpages for your projects. There will be only one site for each project, but we want everyone to set up their own neighborhood page the project webpage will link to.
Create a github page for your neighborhood.
- If you haven't done so already, set up a repository for your neighborhood project (see the getting started tutorials from Lab 6 on how to set up a repository).
- Follow through the options for setting up a page for your project (right under the "Ready to get started?" choose 'Project site').
- Include on your neighborhood page:
- the name of the neighborhood,
- the highlighted map from HC6 as an image
- the basic demographics & statistics from HC 2
- one paragraph summarizing your observations from HC3
- one paragraph summarizing your observations from HC4
- a summary of your results from HC7 and HC8 along with plot images, and
- the map from HC9 (embedded as iframe -- see below)
To embed an html as an iframe use the following html tag (assuming your map is called manhattan.html and it lives in the same directory as the page you want to embed it into)
<iframe src="manhattan.html" width="600" height="400" frameborder="0" frameborder="0" marginwidth="0" marginheight="0" allowfullscreen></iframe>
If you are using markdown, you can insert html code by surrounding it with dl tags as in:
<dl>
<iframe src="manhattan.html" width="600" height="400" frameborder="0" frameborder="0" marginwidth="0" marginheight="0" allowfullscreen></iframe>
</dl>
Individual submission: Submit a .pdf file that contains the URL of your project on github (web address) and a screenshot of your project.
Useful links:
- Markdown Cheatsheet
- If you prefer to watch a video tutorial instead of following the github tutorial page linked above, there are plenty, non-official, youtube videos on how to set up your first Gihub webpage... choose the one you prefer to listen to.
Generate a project webpage with a small introduction that includes the information in your slides, a brief summary of your borough overview (from HC2, HC3, HC8) and links to all neighborhood webpages.
Group submission: Submit the slides of your group presentation (two slides) as a .pdf file. Your slides should include who is on the team, the neighborhoods you looked at, a brief description/summary of the project and a link to the project webpage (your presentation must be 3-5 minutes).
During our meeting each team will share their project webpage and the rest of the class will provide constructive feedback for improvement.
As per your Team Contract signed at the beginning of the semester, you will evaluate each member of your team by filling out and submitting this form. After you fill it out, submit the form as pdf.
Each team will present their project (5 minutes each, 2 slides), then we will break into groups and our visitors will join different groups where you will do a poster-like presentation using the project webpage to talk more about your project and individual contributions.