Submit the following programs via Gradescope:
- Due Date: 10 September Reading: Think CS: Chapters 1 & 2 & Lab1
Write a program that prints "Hello, World!" to the screen.
Hint: See the Lab 1.
- Due Date: 11 September Reading: Think CS: Chapter 4 & Lab1
Write a program that draws a star.

Note: Whenever submitting a turtle program, choose a name for your file that is not turtle.py. When executing the "import turtle" statement, the computer first looks in the folder where the file is saved for the turtle module and then in the libraries (and other places on the path). So, it thinks the module is itself, causing all kinds of errors. To avoid this, name your program something like "myTurtle.py" or "program2.py".Hint: See the Lab 1.
- Due Date: 11 September Reading: Think CS: Chapter 4 & Lab1
Copy the program from Section 4.3 into a file on your computer and modify the program to have a 'hotpink' background, tess color black, alex color 'lightgreen' and let alex draw a pentagon instead of a square:

Note: Make only the modifications indicated here, all other behaviors should stay the same. (i.e. distance forward, pen size etc.)
- Due Date: 14 September Reading: Think CS:
Chapter 4 & Lab1
Write a program that implements the pseudocode ("informal high-level description of the operating principle of a computer program or other algorithm") below:
    Set the turtle shape to be a turtle
    Set the color to purple

    Repeat i 15 times:
        Walk forward 50 steps
        Turn left 24 degrees

    Turn left 125 degrees

    Repeat i 15 times:
        Walk forward 50 steps
        Turn left 24 degrees

    Turn left 125 degrees

    Repeat i 15 times:
        Walk forward 50 steps
        Turn left 24 degrees
Your output should look similar to:

- Due Date: 14 September Reading: Think CS:
Chapter 4 & Lab1
Write a program that uses turtle graphics to generate the image below:

Here is a complete list of turtle commands for your reference.
Hint: Look up the difference between pencolor() and fillcolor(). Let the turtle move forward 200 steps. Use the sequence forward/left/stamp.
More hints:While many of you may have noticed that this image is very similar to that of the Turtle star program on the turtle documentation page, that program includes things we didn't cover yet or simply don't want to do in this context and, unless you are feeling adventurous, it is best to ignore that code.
Instead, while the above image is certainly inspired by that Turtle star, this assignment aims to challenge you to analyze the image to deduce the process (given a description of the output, write the program to produce it), which is how software developers often approach problems.
So what should you do? Try to puzzle out the image, break down what the turtle does, then apply what you have learned so far about definite loops (for loops) and turtle graphics to reproduce that process. Here some guiding questions:- How many turtles do you see? How many repetitions?
- What does the turtle do in each repetition?
- Once you figured out the answer to the previous two questions, play around with the angle to produce the image.
- Look up the turtle functions pencolor() and fillcolor() to produce the turtle colors?
- You have used that background color before, what color was it?
Lecture / Lab 2
- Due Date: 17 September Reading: Think CS: Chapters 2 & 9 & Lab 2
Using the string commands introduced in Lab 2, write a Python program that prompts the user for a message, and then prints that message, the message in upper case letters and the message in lower case letters.
A sample run of your program should look like:>
  Enter a message:  Mihi cura futuri
  Mihi cura futuri
  MIHI CURA FUTURI
  mihi cura futuri
Another sample run:
  Enter a message:  I love Python!
  I love Python!
  I LOVE PYTHON!
  i love python!
Hint: Your program should be able to take any phrase the user enters. To do that, you need to store the phrase in a variable and print variations of the stored variable.
- Due Date: 17 September Reading: Think CS: Chapters 2 & 9 & Lab 2
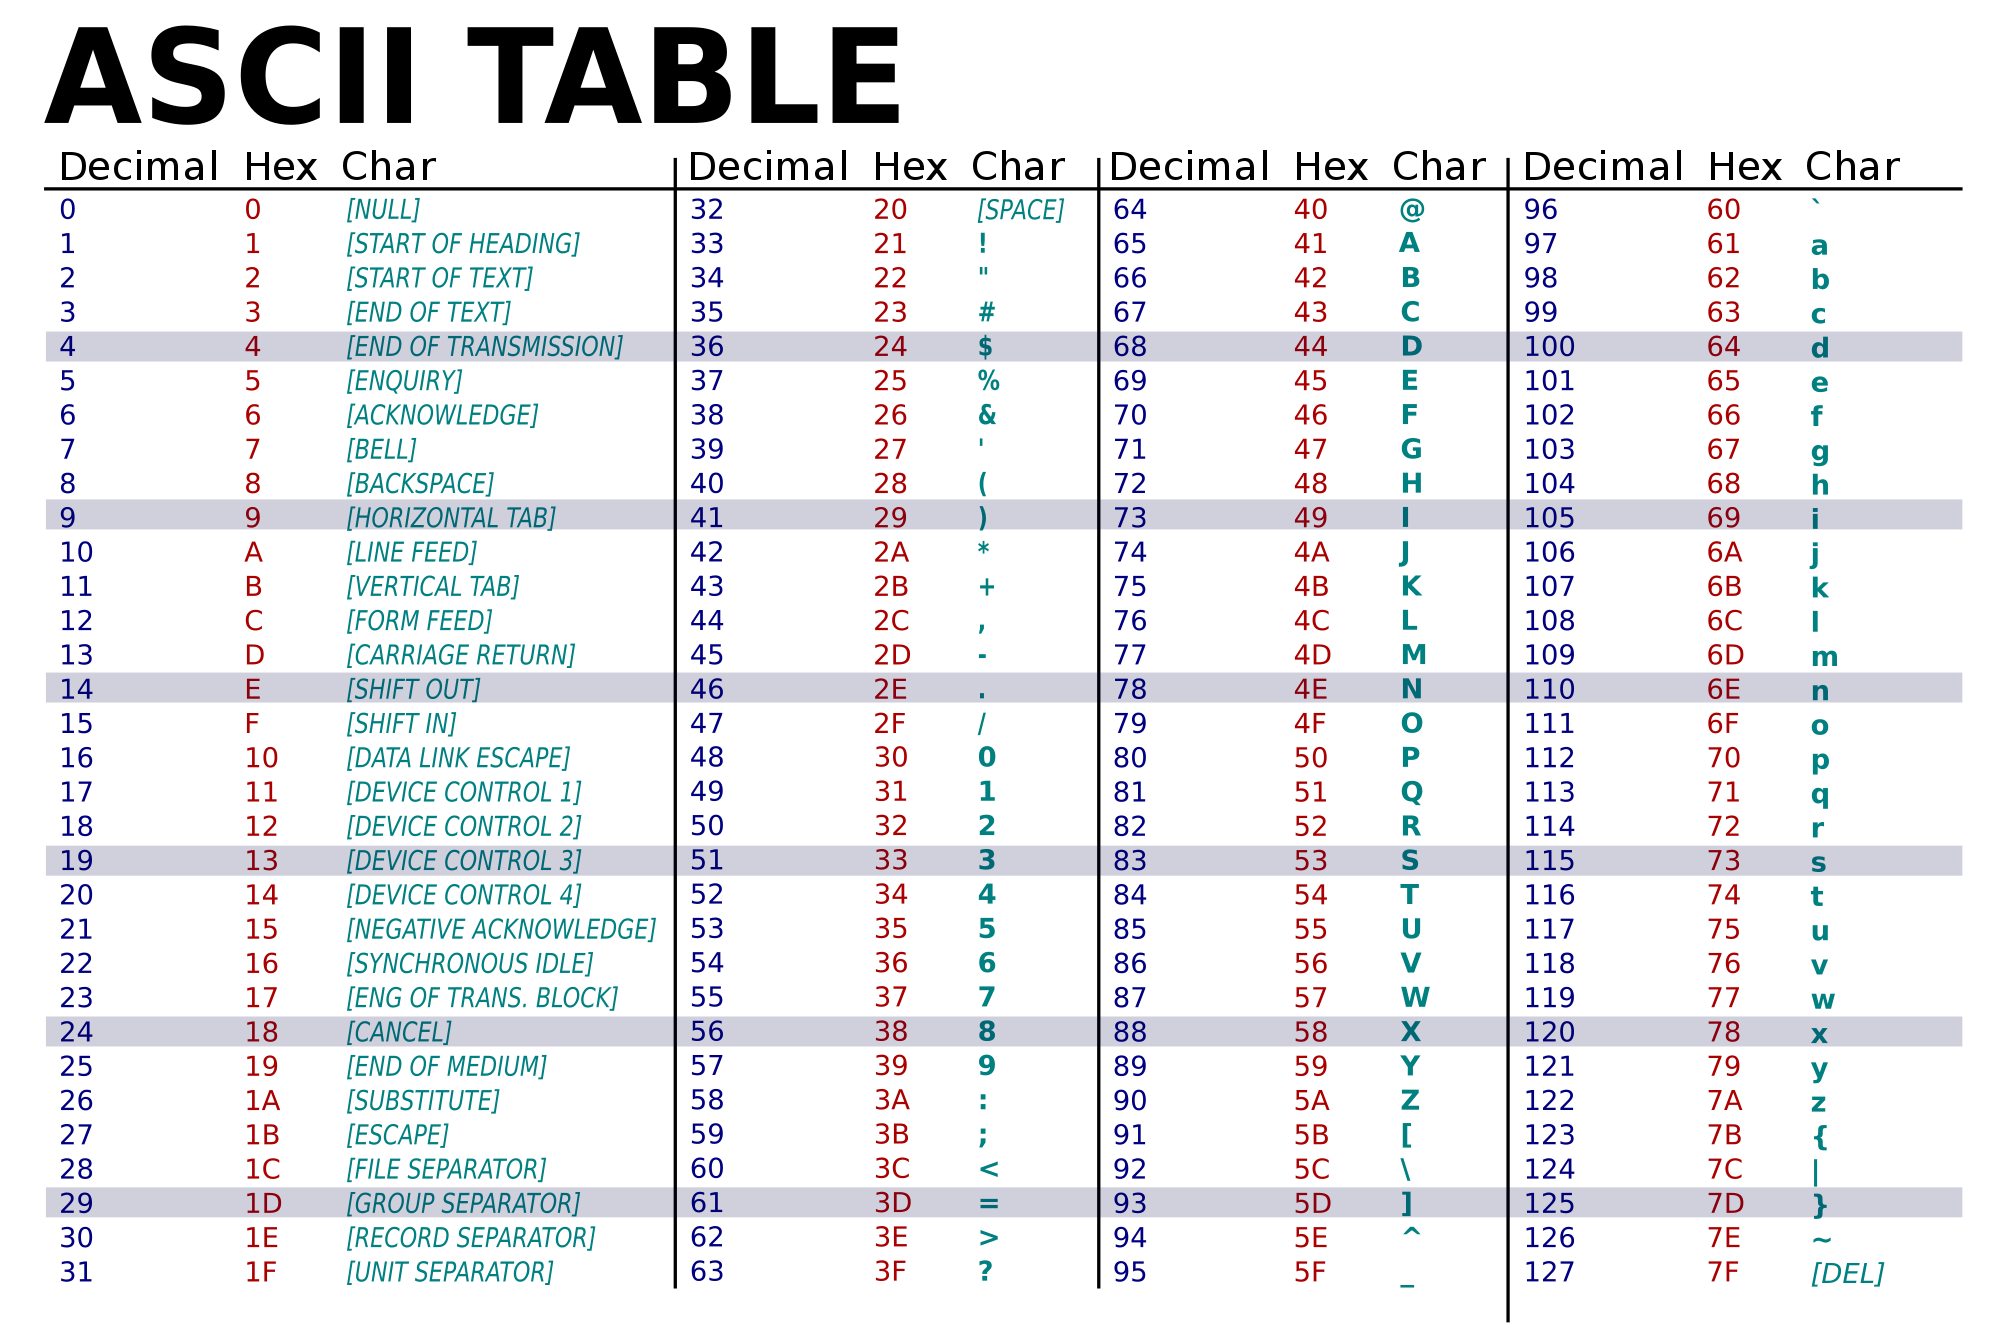
Combining ord() and chr() write a program that:
- Prompts the user to enter a message
- Prints each character in the message, its Unicode number + 1 and the character corresponding to that number.
 Enter a message:  abc
 a 98 b
 b 99 c
 c 100 d
Another run:
 Enter a message: Hello
 H 73 I
 e 102 f
 l 109 m
 l 109 m
 o 112 p
- Due Date: 21 September Reading: Think CS: Section 4.7 & Lab2
Write a program that prints out the odd numbers from 1 to 23.
The output of your program should be:
1
3
5
7
9
11
13
15
17
19
21
23
Hint: Use the
start, stop, stepoptions in therange()function - Due Date: 21 September Reading: Think CS: chapter 9, Section 10.24 & Lab 2
Write a problem that does the following:
- Prompt for a phrase & read it in.
- Make the phrase upper case.
- Split up the phrase into words.
- Take the first letter of each word (keep in mind that split() returns a list of the words ), concatenate and make an acronym of it
 Enter a phrase:  City University New York
 Your phrase in capital letters:  CITY UNIVERSITY NEW YORK
 Acronym:  CUNY
Another run:
  Enter a phrase:  Hunter College
  Your phrase in capital letters:  HUNTER COLLEGE
  Acronym:  HC
- Due Date: 21 September Reading: Think CS: Chapters 2 & 9 & Lab 2

(The cipher disk above shifts 'A' to 'N', 'B' to 'O', ... 'Z' to 'M', or a shift of 13. From secretcodebreaker.com.)Write a program that prompts the user to enter a word and then prints out the word with each letter shifted right by 13 characters.
Assume that all inputted words are in upper case letters: 'A',...,'Z'.A sample run of your program should look like:
  Enter a word: ZEBRA
  Your word in code is MROEN
Hint: See the example programs from Lecture to find out how to wrap around (Lecture slides can be found on the course outline).
Lecture / Lab 3
- Due Date: 24 September Reading: Think CS: Chapter 4 & Lab 3
Modify the program from Lab 3 to show the shades of blue and then repeat the same loop, but backwards.
Your output should look similar to:

- Due Date: 25 September Reading: Think CS: Chapter 4 & Lab 3
Now modify the program from Lab 3 to transition from shades of red to shades of blue by moving forward 20 steps instead of 10.
Your output should look similar to:

Hint: decrease the amount of red while increasing the amount of blue by the same amount using the loop variable
- Due Date: 1 October
Reading: Think CS: Section 10.24, Lab 2 & Lecture 3
Write a program that prompts the user to enter a list of names. Each person's name is separated from the next by a semi-colon and a space ('; ') and the names are entered lastName, firstName (i.e. separated by ', '). Your program should then print out the names, one per line, with the first initial of the first name, followed by ".", and followed by the last name.
A sample run of your program should look like:
    Please enter your list of names:  Lovelace, Ada; Fleming, Williamina; Hopper, Grace; Easley, Annie; Wilkes, Mary Allen

    A. Lovelace
    W. Fleming
    G. Hopper
    A. Easley
    M. Wilkes

    Thank you for using my name organizer!
Hint: See Section 10.24 for a quick overview of split(). Do this problem in parts: first, split the list by person (what should the delimiter be?). Then, split each of person's name into first and last name (what should the delimiter be here?). If you have a string str, what is s = str[0] + "."?
- Due Date: 2 October
Reading: Section 10.24, Lab 2 & Lab 3
Write a program that asks the user for a 6-digit hex number and uses it as the hex code to stamp a turtle of that color.
A sample run of the program:
Please enter a 6-digit Hexadecimal number: FF00FF
which produces an output:

Hint: don't forget to add the '#' at the beginning of the hex number to use it as a hex encoding for color! For string concatenation see Lab 2. You may assume that the user always inputs a valid 6-digit Hex number.
- Due Date: 5 October
Reading: Think CS: Section 8.10 &
Datacamp Numpy Tutorial & Lab 3
Write a program that asks the user for a name of an image .png file and the name of an output file. Your program should create a new image that has only the red and blue channels of the original image (that is, no green channel).
To test your program you can download csBridge.png
A sample run of your program should look like:
Enter name of the input file:  csBridge.png
Enter name of the output file:  nogreenH.png
Sample input and resulting output files:
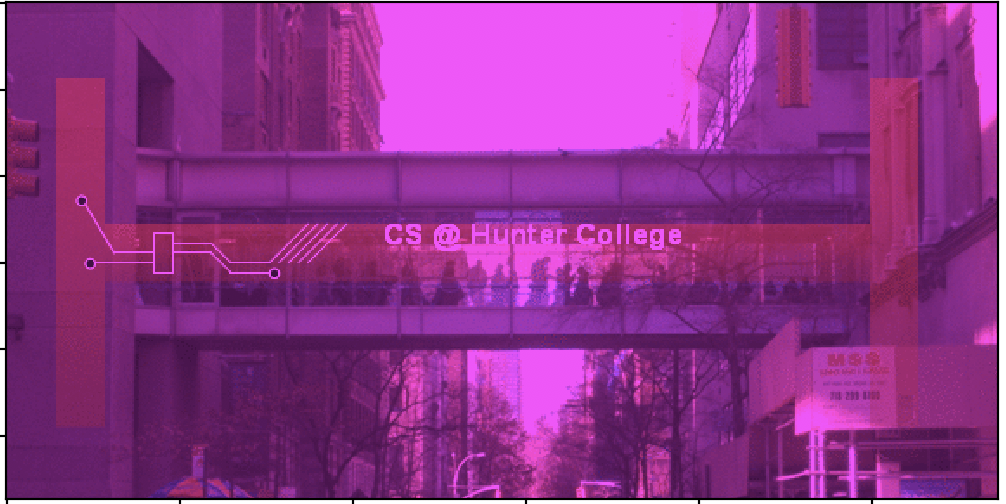
IMPORTANT: before submitting your program for grading, remove the commands that show the image (i.e. the ones that pop up the graphics window with the image). The program is graded on a server on the cloud and does not have a graphics window, so, the plt.show() and plt.imshow() commands will give an error. Instead, the files your program produces are compared pixel-by-pixel to the answer to check for correctness.
Hint: See Lab 3.
Lecture / Lab 4
- Due Date: 8 OctoberReading: Think CS: Chapter 2 & Lab 4
Write a program that asks for the time in seconds and converts it to 12-hour time.
A sample run of your program should look like:
  Please enter the time in seconds: 7695
  2h: 8m: 15s
Hint Don't forget to convert the input into a numeral for calculation. - Due Date: 8 October Reading: Think CS: Chapter 4 and Chapter 7.4, Lab1 & Lab 4
Write a program that implements the following pseudocode using turtles:
Ask the user for number of stamps
Set the turtle shape to 'circle'
Lift the turtle pen up
Set steps to 20
Repeat stamps times:
    Stamp
    If the number of this loop iteration is divisible by 4
        Increment steps by 2
    Move foward by steps
    Turn right by 24 degrees
A sample run of your program should look like:
Enter number of stamps the turtle will print: 100
and the output should look similar to:

For your reference, here is a complete list of turtle commands.
- Due Date: 9 October
Reading: Think CS: Datacamp Numpy Tutorial, Lab 3 & Lecture 4
In Lecture 4, we designed a program to make a Hunter logo 'H' on a 10x10 grid. Write a program that creates a blue 'U' logo for University on a 30x30 grid.

The grading script is expecting:
- The file to be saved as: logo.png.
- The grid to be 30 x 30.
- The 'U' to be 0% red, 0% green, and 100% blue. The lower part of the 'U' should be the lower third of the image; the left part of the 'U' should be the left third of the image; and the right part of the 'U' should be the the right third of the image.
- The remaining pixels in the image should be white (100% red, 100% green, and 100% blue).
Note: before submitting your program for grading, remove the commands that show the image (i.e. the ones that pop up the graphics window with the image). The program is graded on a server on the cloud and does not have a graphics window, so, the plt.show() and plt.imshow() commands will give an error. Instead, the files your program produces are compared pixel-by-pixel to the answer to check for correctness.
Hint: See notes from Lecture 4. (Lecture slides can be found on the course outline)
- Due Date: 9 October Reading: Think CS: Section 2.7 & Lab 4
Write a program that implements the pseudocode below:
1.  Ask the user for the number of cents as an integer (e.g. 99 not 0.99).
2.  Print out the number of quarters (quarters = cents // 25).
3.  Compute the remaining change (rem = cents % 25).
4.  Print out the number of dimes (dimes = rem // 10).
5.  Compute the remaining change (rem = rem % 10).
6.  Print out the number of nickels (nickels = rem // 5).
7.  Print out the remaining cents (cents = rem % 5).
Be sure to print how many of each coin type in the given order (quarters, followed by dimes, followed by nickels, followed by cents) each on a new line.
A sample run of your program should look like:
Enter the number of cents: 99
Quarters: 3
Dimes: 2
Nickels: 0
Cents: 4
and another sample run:
Enter the number of cents: 62
Quarters: 2
Dimes: 1
Nickels: 0
Cents: 2
Hint: See Section 2.7.
- Due Date: 9 October
Reading: Think CS: Chapters 2 & 8.10 &
Datacamp Numpy Tutorial & Lab 4
Modify the flood map of NYC from Lab 4 to color the region of the map with elevation greater than 5 feet and less than or equal 15 feet above sea level the color grey (50% red, 50% green, and 50% blue).
Your resulting map should look like:

and be saved to a file called floodMap.png.
Note: before submitting your program for grading, remove the commands that show the image (i.e. the ones that pop up the graphics window with the image). The program is graded on a server on the cloud and does not have a graphics window, so, the plt.imshow() and plt.show() commands will give an error. Instead, the files your program produces are compared pixel-by-pixel to the answer to check for correctness.
Lecture / Lab 5
- Due Date: 15 October -- Review from Lecture 4 Reading: Think CS: Section 8.10 &
Datacamp Numpy Tutorial, Lab 3, Lab 4 & Lecture 4
Write a program that creates an image of green and white horizontal stripes. Your program should ask the user for the size of your image, the name of the output file, and create a .png file of stripes. For example, if the user enters 10, your program should create a 10x10 image, alternating between green and white stripes.
A sample run of the program:
  Enter the size: 10
  Enter output file: 10stripes.png

Another sample run of the program:
  Enter the size: 50
  Enter output file: 50stripes.png

Note: before submitting your program for grading, remove the commands that show the image (i.e. the ones that pop up the graphics window with the image). The program is graded on a server on the cloud and does not have a graphics window, so, the plt.show() and plt.imshow() commands will give an error. Instead, the files your program produces are compared pixel-by-pixel to the answer to check for correctness.
- Due Date: 16 October Reading: Think CS: Chapters 7 & 8.10 &
Datacamp Numpy Tutorial & Lab 5
Following Lab 5, write a program that asks the user for the name of a .png file and print the number of pixels that are nearly white (the fraction of red, the fraction of green, and the fraction of blue are all above 0.8).
For example, if your file was of the snow pack in the Sierra Nevada mountains in California in September 2014:

then a sample run would be:
Enter file name:  caDrought2014.png
Snow count is 38010
Note: for this program, you only need to compute the snow count. Showing the image will confuse the grading script, since it's only expecting the snow count.
- Due Date: 16 October Reading: Burch's Logic & Circuits & Lab 5
Build a circuit that has the same behavior as a NAND gate (i.e. return False only if both inputs are True) using only AND, OR, and NOT gates.
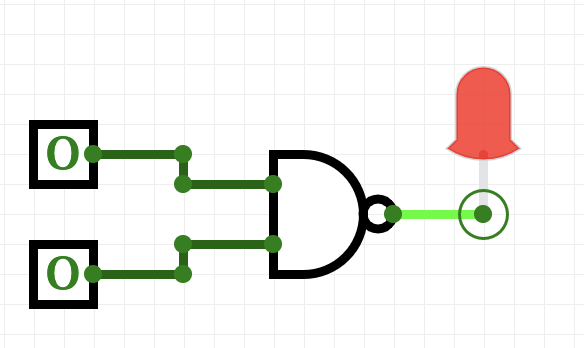
Here is the truth table for the nand operator:
in1 in2 in1 nand in2 True True False False True True True False True False False True Save your expression to a text file. See Lab 5 for the format for submitting logical expressions to Gradescope.
- Due Date: 19 October
Reading: Burch's Logic & Circuits & Lab 5
Write a logical expression using only and, or and not that is equivalent to the Exclusive NOR (XNOR) gate on 2 inputs, called in1, in2:
- If both inputs are True or both inputs are False (i.e. inputs have same value), then your expression should evaluate to True.
- Otherwise your expression should evaluate to False.
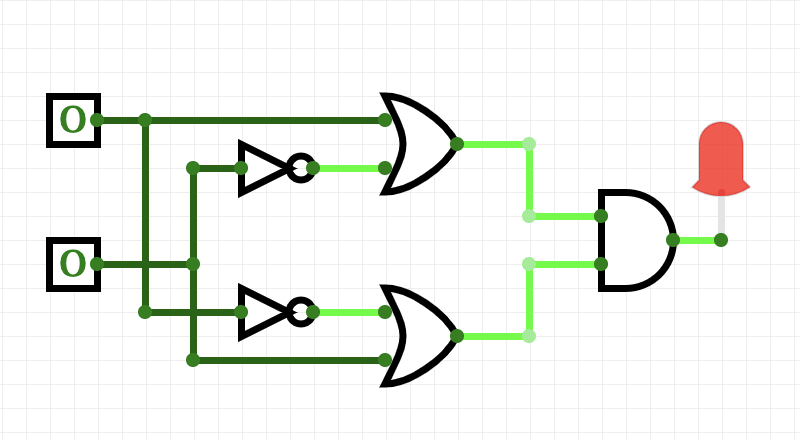
Save your expression to a text file. See Lab 5 for the format for submitting logical expressions to Gradescope.
- Due Date: 19 October Reading: Burch's Logic & Circuits & Lab 5
Logical gates can be used to do arithmetic on binary numbers. For example, we can write a logical circuit whose output is one more than the inputted number. Our inputs are in1 and in2 and the outputs are stored in out1, out2, and out3.
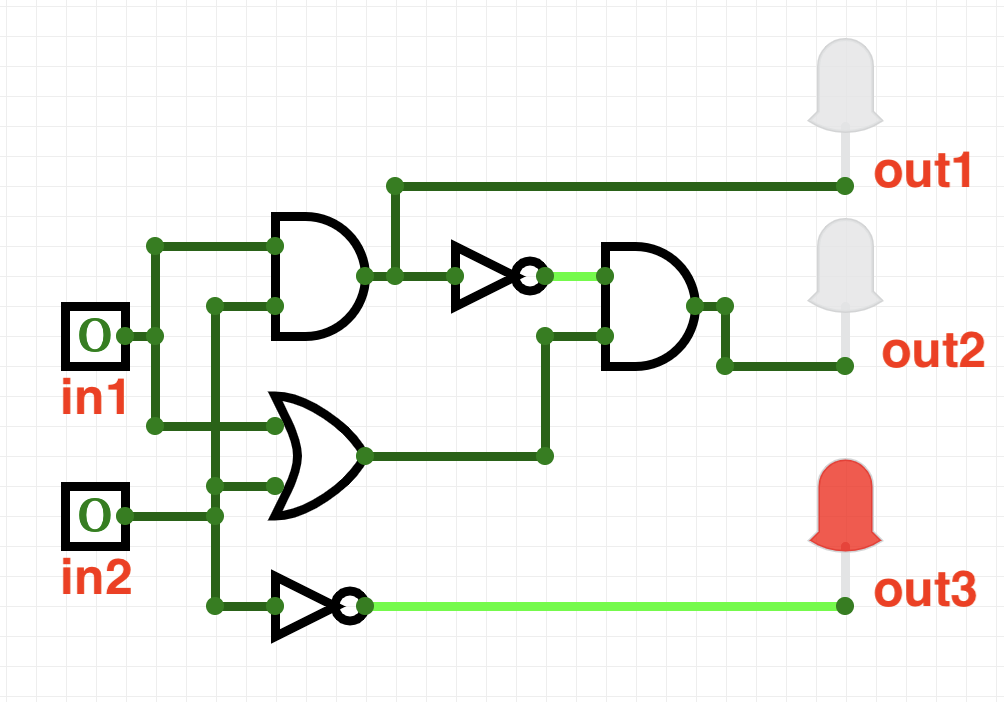
Here is a table of the inputs and outputs:
Inputs Outputs Decimal
Numberin1 in2 Decimal
Numberout1 out2 out3 0 0 0 1 0 0 1 1 0 1 2 0 1 0 2 1 0 3 0 1 1 3 1 1 4 1 0 0 Toggle the inputs, by clicking on the input boxes for in1 and in2, and observe the output. Then translate the circuit into a logical expression.
Submit a text file (.txt) with each of the outputs on a separate line:
    #Name:  YourNameHere
    #Date:  November 2017
    #Logical expressions for a 3-bit incrementer

    out1 = ...
    out2 = ...
    out3 = ...
Where "..." is replaced by your logical expression (see Lab 5).Note: here's a quick review of binary numbers.
Lecture / Lab 6
- Due Date: 22 October Reading: 10-mins to Pandas, DataCamp Pandas & Lab 6
Modify the program from Lab 6 that displays the NYC historical population data. Your program should ask the user for the name of two boroughs, and the name for the output file, and then display the fraction of the population that has lived in both boroughs (i.e. the fraction of their sum), over time.
A sample run of the program:
Enter first borough name:  Queens
Enter second borough name:  Brooklyn
Enter output file name:  QBFraction.png
The file QBFraction.png:
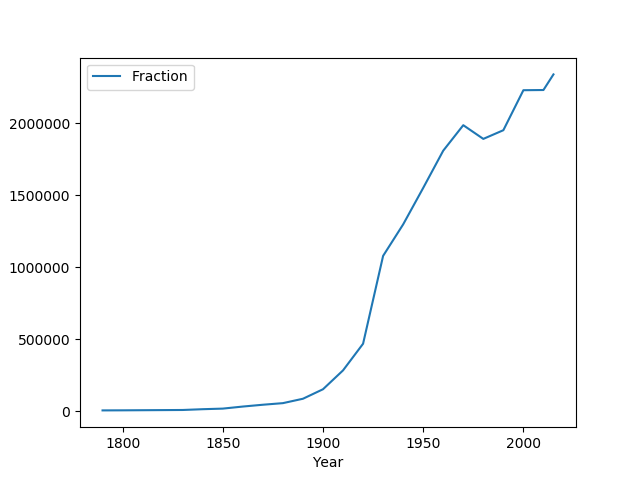
Note: before submitting your program for grading, remove the commands that show the image (i.e. the ones that pop up the graphics window with the image). The program is graded on a server on the cloud and does not have a graphics window, so, the plt.show() and plt.imshow() commands will give an error. Instead, the files your program produces are compared pixel-by-pixel to the answer to check for correctness.
- Due Date: 23 October Reading: 10-mins to Pandas, DataCamp Pandas & Lab 6
Write a program that computes the minimum, maximum, average, median and standard deviation of the population over time for a borough (entered by the user). Your program should assume that the NYC historical population data file, nycHistPop.csv is in the same directory.
A sample run of your program:
Enter borough: Staten Island
Min: 727
Max: 474558
Mean: 139814.23076923078
Median: 59357.0
Standard Deviation: 162706.80974594955
and another run:
Enter borough: Brooklyn
Min: 2017
Max: 2738175
Mean: 1252437.5384615385
Median: 1002564.5
Standard Deviation: 1153123.5551968655
Hint: See Lab 6.
- Due Date: 23 October Reading:
Github Guide & Lab 6
In Lab 6, you created a github account. Submit a text file with the name of your account. The grading script is expecting a file with the format:
#Name:  Your name
#Date:  September 2020
#Account name for my github account

AccountNameGoesHere
Note: it takes a few minutes for a newly created github account to be visible. If you submit to gradescope and get a message that the account doesn't exist, wait a few minutes and try again.
- Due Date: 26 October Reading:
Ubuntu Terminal Reference Sheet & Lab 6
Write an Unix shell script that prints: Hello!
Then prints on a new line: Welcome to Hunter College!!!Submit a single text file containing your shell commands. See Lab 6 for details.
- Due Date: 26 October
Reading: 10-mins to Pandas, DataCamp Pandas & Lab 6
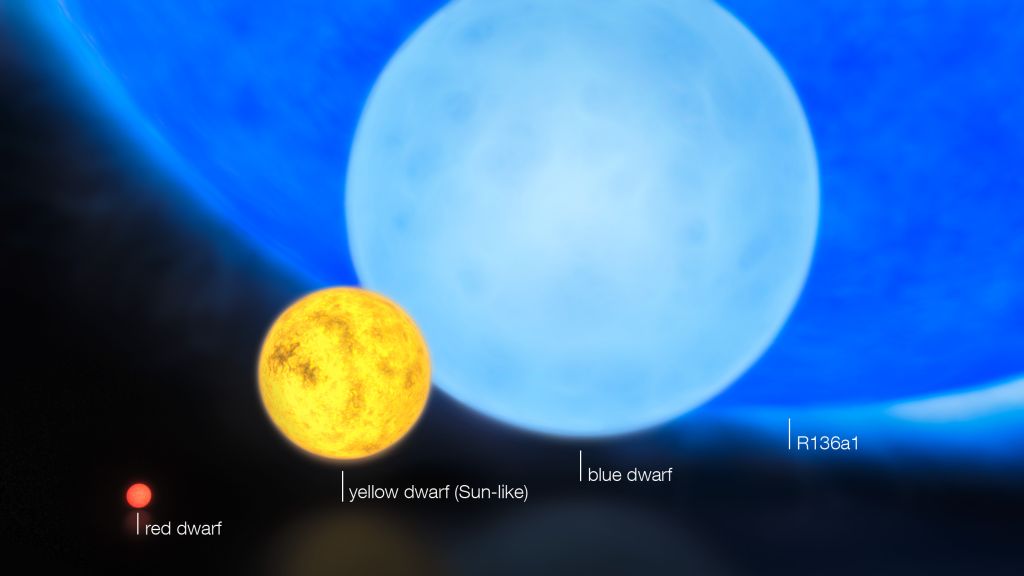
Write a program that, given the 'Stars' dataset will do the following:
- Ask the user for the name of the input file.
- Ask the user for the name of the column they wish to average (one of Temperature, Luminosity, Radius or Absolute Magnitude)
- Print the average of that column for each star type.
Note: To put the data in perspective, keep in mind that these measures are given as multiples of those of the Sun! (image credits: space.com)
A sample run:
Enter file name: stars.csv
Enter the name of the column
(Temperature, Luminosity, Radius or Absolute Magnitude)
you would like to average: Luminosity

The average Luminosity for each Star type is:
Star type
Brown Dwarf           0.000693
Hypergiant       309246.525000
Main Sequence     32067.386275
Red Dwarf             0.005406
Supergiant       301816.250000
White Dwarf           0.002434
Name: Luminosity, dtype: float64
Another sample run:
Enter file name: stars.csv
Enter the name of the column
(Temperature, Luminosity, Radius or Absolute Magnitude)
you would like to average: Temperature

The average Temperature for each Star type is:
Star type
Brown Dwarf       2997.950
Hypergiant       11405.700
Main Sequence    16018.000
Red Dwarf         3283.825
Supergiant       15347.850
White Dwarf      13931.450
Name: Temperature, dtype: float64
Note: You may assume that input is correct (e.g. only expected columns are entered as input)
Hint: You should use groupby() as described in Lab 6.
Lecture / Lab 7
- Due Date: 29 October Reading: 10-mins to Pandas, DataCamp Pandas & Lab 7
Modify the program from Lab 7 that displays shelter population over time to:
- ask the user to specify the input file,
- ask the user to specify the output file,
- make a plot of the fraction of the total population that are single adult women over time from the data in input file, and
- store the plot in the output file the user specified.
A sample run of the program:
  Enter name of input file:  DHS_2015_2016.csv
  Enter name of output file:  dhsPlot.png
which produces an output:
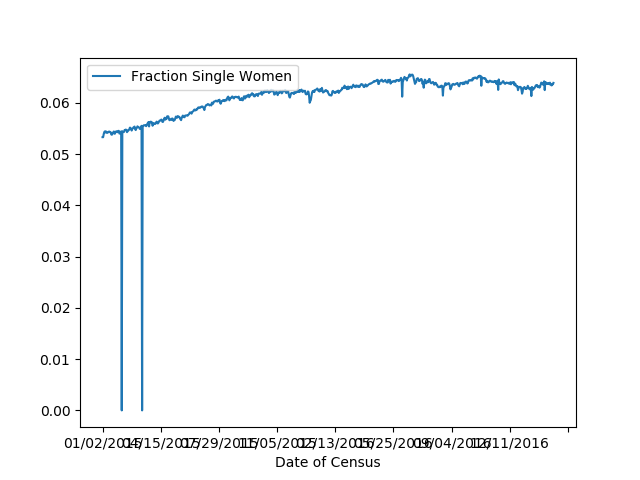
Note: The grading script is expecting that the label (i.e. name of your new column) is "Fraction Single Women".
- Due Date: 30 October Reading: 10-mins to Pandas, DataCamp Pandas, Lab 6 & Lab 7
Much of the data collected by city agencies is publicly available at NYC Open Data. Let's explore another dataset!
We'll start by downloading data that has information from New York City air quality surveillance:
Click on the "View Data" button. We are going filter the data to be all measurements between 2009 and 2011 and look at Rate measurements. To do this:
- Click on the "Filter" button.
- On the menu that pops us, click on "Add a New Filter Condition".
- Choose "year_description" and keep the option "is".
- Click in the box below and type "2009-2011".
- Click the check box to the left of the data.
- Click on "Add a New Filter Condition" again (below).
- Choose "name" and change the option "contains".
- Click in the box below and type "Asthma".
- Click the check box to the left of the data.
- The data will now be filtered to the Asthma visits or hospitalizations that are attributble to air pollution during the years 2009-2001.
To download the file,
- Click on the "Export" button.
- Under "Download", choose "CSV".
- The download will begin automatically (files are usually stored in "Downloads" folder).
Now modify the programs from Lab 6 that aggregates rainfall data and the program from Lab 7 that plots shelter population to:
- ask the user to specify the input file,
- ask the user to specify the output file,
- to observe the average asthma cases due to air pollution by neighborhood:
- use groupby() to aggregate the data by 'geo_entity_name' and average the 'data_valuemessage' column
- make a bar plot of the data grouped this way by using .plot.bar() on the grouped data
e.g. if you have
grouped_data = df.groupby( ...
then use grouped_data.plot.bar() to generate the bar plot - store the plot in the output file the user specified.
A sample run of the program:
Enter name of input file:  air_pollution.csv
Enter name of output file:  neighborhood_barplot.png
which produces an output:
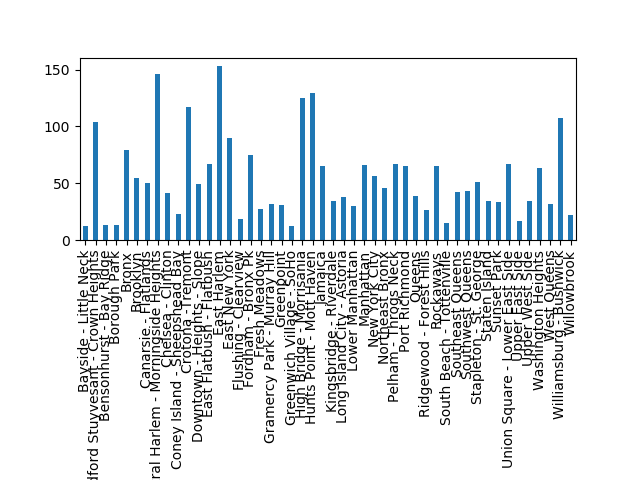
Note: To make the neighborhood names visible at the bottom of the bar plot, use plt.gcf().subplots_adjust(bottom=0.5) before plt.gcf() (see Lab 6 for how to save the plot to a file.)
- Due Date: 30 October Reading: Think CS Section 6.7 & Lab 7
Write a program, using a function main() that prints "I love Python!" to the screen. The program should be executable as stand-alone program as well as included as a module. See Lab 7.
- Due Date: 2 November
Reading: 10-mins to Pandas, DataCamp Pandas & Lab 7
In Lab 7, we worked through a program that displayed the homeless shelter occupancy over time. The same approach can be used for displaying any dataset where the date and time are stored.
For this program, use the lab as a starting point to display public school attendance from NYC OpenData. If you would like to test your program on other data, you can filter for an individual school by viewing the data and filtering on the school number ("School DBN"). Export the file as CSV and save. There is a sample file for the high school on campus on github
Modify the program from Lab 7 that displays shelter population over time to:
- Ask the user to specify the input file,
- Ask the user to specify the output file,
- Convert the date column (which is stored as 'YYYYMMDD') to a datetime format recognized by pandas, for example if your dataframe is df, overwrite the 'Date' column to be:
df["Date"] = pd.to_datetime(df["Date"].apply(str))
- Make a plot of the percent of present students over time from the data in the input file, and
- Store the plot in the output file the user specified.
A sample run of the program:
Enter name of input file:  dailyAttendanceManHunt2018.csv
Enter name of output file:  manHunt.png
which produces an output:
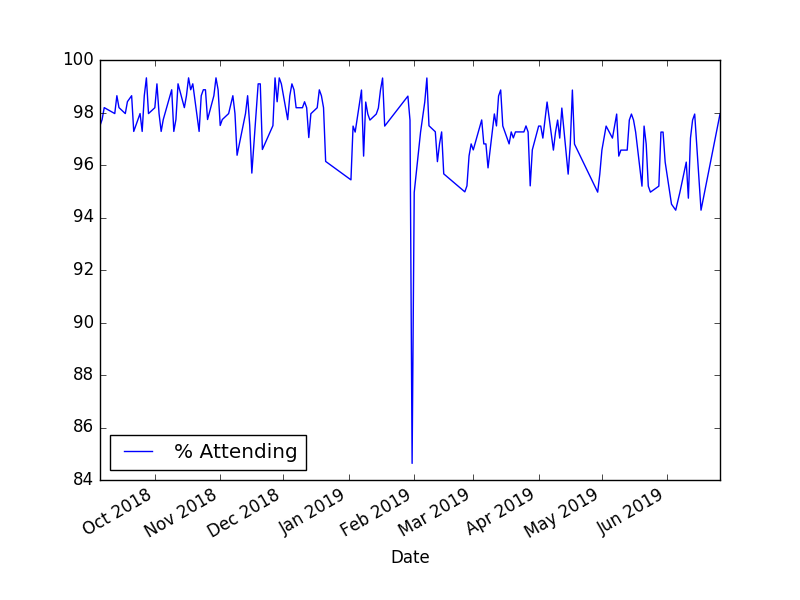
Note: The grading script is expecting that the label (i.e. name of your new column) is "% Attending" and the range of values be between a percentage between 0 and 100 (Hint: what do you multiply by to convert a fraction into a percentage?).
- Due Date: 2 November
Reading: Think CS: Chapter 7.4, Turtle Graphics & Lab 6
REVIEW
The program, turtleString.py (available at: https://github.com/HunterCSci127/CSci127) takes a string as input and uses that string to control what the turtle draws on the screen (inspired by code.org's graph paper programming). Currently, the program processes the following commands:
- 'F': moves the turtle forward 50 steps
- 'L': turns the turtle 90 degrees to the left
- 'R': turns the turtle 90 degrees to the right
- '^': lifts the pen
- 'v': lowers the pen
- 'r': change turtle color to red
- 'g': change turtle color to green
- 'b': change turtle color to blue
Modify this program to allow the user also to specify with the following symbols:
- 'S': makes the turtle stamp
- 'D': makes the turtle stamp a dot
- 'B': moves the turtle backwards 50 steps
- 'p': change the turtle color to purple
Hint: See Lecture 4 notes.
Lecture / Lab 8
- Due Date: 5 November Reading: Think CS: Chapter 6 & Lab 8
Write a function, computeFare(), that takes as two parameters: the zone and the ticket type, and returns the Long Island Railroad fare.
- If the zone is 1 and the ticket type is "peak", the fare is 8.75.
- If the zone is 1 and the ticket type is "off-peak", the fare is 6.25.
- If the zone is 2 or 3 and the ticket type is "peak", the fare is 10.25.
- If the zone is 2 or 3 and the ticket type is "off-peak", the fare is 7.50.
- If the zone is 4 and the ticket type is "peak", the fare is 12.00.
- If the zone is 4 and the ticket type is "off-peak", the fare is 8.75.
- If the zone is 5, 6, or 7 and the ticket type is "peak", the fare is 13.50.
- If the zone is 5, 6, or 7 and the ticket type is "off-peak", the fare is 9.75.
- If the zone is greater than 8, return a negative number (since your calculator does not handle inputs that high).
A template program, LIRRtransit.py, is available on the CSci 127 repo on github. The grading script does not run the whole program, but instead tests your function separately ('unit tests') to determine correctness. As such, the name of the function must match exactly (else, the scripts cannot find it).
A sample run:
  Enter the number of zones: 4
  Enter the ticket type (peak/off-peak): off-peak
  The fare is 8.75
And another:
  Enter the number of zones: 6
  Enter the ticket type (peak/off-peak): peak
  The fare is 13.5
Hint: See Lab 8.
- Due Date: 6 November
Reading: 10-mins to Pandas, DataCamp Pandas & Lab 7 & Lab 8
Write a program that asks the user for a CSV of the NYC OpenData Film Permits:
- There is a sample file for June 2019 film permits on github.
- the total number of permits in the file,
- the count of permits for each borough, and
- the three most popular type of events (stored in the column: "EventType").
A sample run:
  Enter file name: filmPermitsJune2019.csv
  There were 643 film permits.
  Manhattan        336
  Brooklyn         165
  Queens            70
  Staten Island     42
  Bronx             30
  Name: Borough, dtype: int64


  The three most popular type of events were:
  Shooting Permit                  532
  Theater Load in and Load Outs     77
  Rigging Permit                    26
  Name: EventType, dtype: int64
This assignment uses film permit data collected and made publicly by New York City Open Data, and can be found at:
https://data.cityofnewyork.us/City-Government/Film-Permits/tg4x-b46p.
Since the files are quite large, use the "Filter" option and a range of dates for "StartDateTime" (for this example we included only permits with 'StartDateTime' in June 2019), then "Export" (in CSV format) all permits for those dates.Hint: See Lab 7 for filtering and downloading data from NYC OpenData and Lab 8 for counting values in structured data.
- Due Date: 6 November Reading: Think CS Chapter 6 & Lab 8
Write two functions, squares() and nestedSquares(). Both functions take two parameters: a turtle and an edge length. The pseudocode for squares() is:
      squares(t, length):
      1.  If length > 10:
      2.     Repeat 4 times:
      3.         Move t, the turtle, forward length steps.
      4.         Turn t left 90 degrees.
      5.     Call squares with t and length/2.
The pseudocode for nestedSquares() is very similar:
      nestedSquares(t, length):
      1.  If length > 10:
      2.     Repeat 4 times:
      3.         Move t, the turtle, forward length steps.
      4.         Turn t left 90 degrees.
      5.         Call nestedSquares with t and length/2.
There is a subdle difference in the pseudocode of the two functions above, but it is very important and makes the difference between the two images. Observe the execution and think about it!!!
A template program, nestingSquares.py, is available on the CSci 127 repo on github. The grading script does not run the whole program, but instead tests your functions separately ('unit tests') to determine correctness. As such, the function names must match exactly (else, the scripts cannot find it). Make sure to use the function names from the github program (it is expecting squares() and nestedSquares()).
A sample run:
Enter edge length: 160
which would produce:

After you successfully submit this program to Gradescope, play around with it and have fun!!!
Try drawing nested triangles, nested pentagons, nested hexagons!!! Look at all the interesting patterns you can make (not for submission). - Due Date: 9 November Reading: Think CS: Chapter 6 and Section 8.10 & Lab 8
Fill in the missing functions:
- average(region): Takes a region of an image and returns the average red, green, and blue values across the region.
- setRegion(region,r,g,b): Takes a region of an image and red, green, and blue values, r, g, b. Sets the region so that all points have red values of r, green values of g, and blue values of b.
The functions are part of a program that averages smaller and smaller regions of an image until the underlying scene is visible (inspired by the elegant koalas to the max).
For example, if you inputted our favorite image, you would see (left to right):


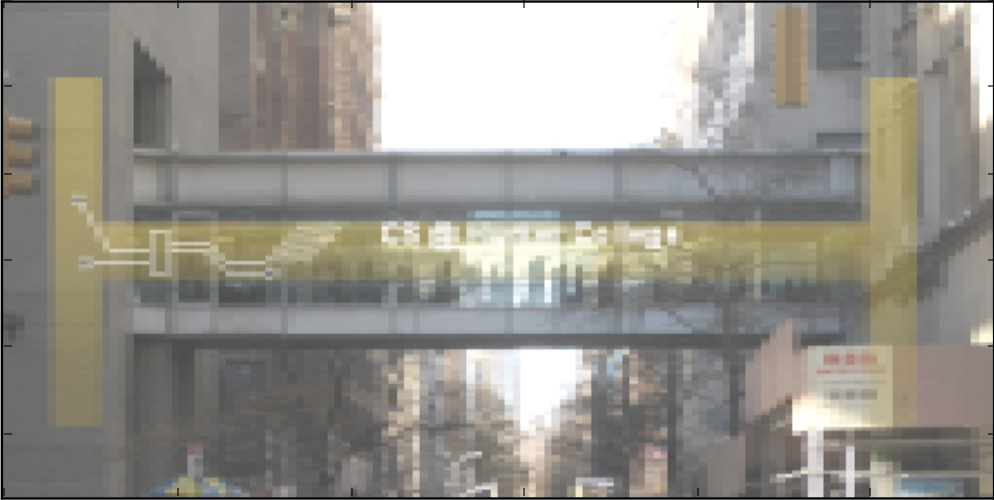
and finally:
Use the template program, averageImage.py, available on the CSci 127 repo on github. The grading script does not run the whole program, but instead runs each of your functions separately ('unit tests') to determine correctness. As such, the names of the functions must match exactly the ones listed above (else, the scripts cannot find them).
IMPORTANT Do not remove anything below and including the comment that says:
  ######################################################################
  ### DO NOT CHANGE ANYTHING BELOW THIS LINE                         ###
  ######################################################################
Hint: See notes from Lecture 8.
- Due Date: 9 November Reading: Think CS: Chapter 6 and Section 7.4 & Lab 8
Write a decision-making program with command-line interface to implement a housing-score calculator (inspired by the 2020 Nifty Decision Makers by Evan Peck)
Your program will consist of two functions:
- main()
- Asks the user 5 questions and stores the answers: year (int), age (int), probation (string), full-time (int), gpa (float) (see sample run below)
- Calls computeScore(answers), where answers is a list containing the variables in which the answers are stored in the order in which they are received (python lists may contain variables of different type)
- Prints the value returned by computeScore
- computeScore(answers)
- Computes the housing score based on the values in answers as follows:
- Current Freshman: 1 point
- Current Sophomore: 2 points
- Current Junior: 3 points
- Current Senior: 4 points
- 23+ Years of Age: 1 point
- Full-Time: 1 point
- Academic Probation: -1 point
- 3.5+ GPA: 1 point
- Returns the housing score
- Computes the housing score based on the values in answers as follows:
A sample run of the program:
  -----------------------------------
  HOUSING SCORE CALCULATOR
  -----------------------------------

  QUESTION 1
  What year are you? (1,2,3,4): 4
  QUESTION 2
  How old are you?: 25
  QUESTION 3
  Are you currently on probation? (Yes or No): No
  QUESTION 4
  Are you Part-time or Full-time? (0 or 1): 1
  QUESTION 5
  What is your GPA?: 3.9

  -----------------------------------
  Your housing score is:  7
  -----------------------------------
And another sample run of the program:
  -----------------------------------
  HOUSING SCORE CALCULATOR
  -----------------------------------

  QUESTION 1
  What year are you? (1,2,3,4): 2
  QUESTION 2
  How old are you?: 19
  QUESTION 3
  Are you currently on probation? (Yes or No): Yes
  QUESTION 4
  Are you Part-time or Full-time? (0 or 1): 0
  QUESTION 5
  What is your GPA?: 2.7

  -----------------------------------
  Your housing score is:  1
  -----------------------------------
The grading script runs the whole program as well as each function separately ('unit tests') to determine correctness. As such, the function names must match exactly as indicated above (else, the scripts cannot find them).
Your program may assume that the input (from the user and to the functions) is always in the expected format.
Hint: See Lab 4 for type conversion and decisions, Lab 7 and Lab 8 for programming with functions.
Lecture / Lab 9
- main()
- Due Date: 12 November Reading: Think CS: Chapters 4 and 6 & Lab 8
REVIEW
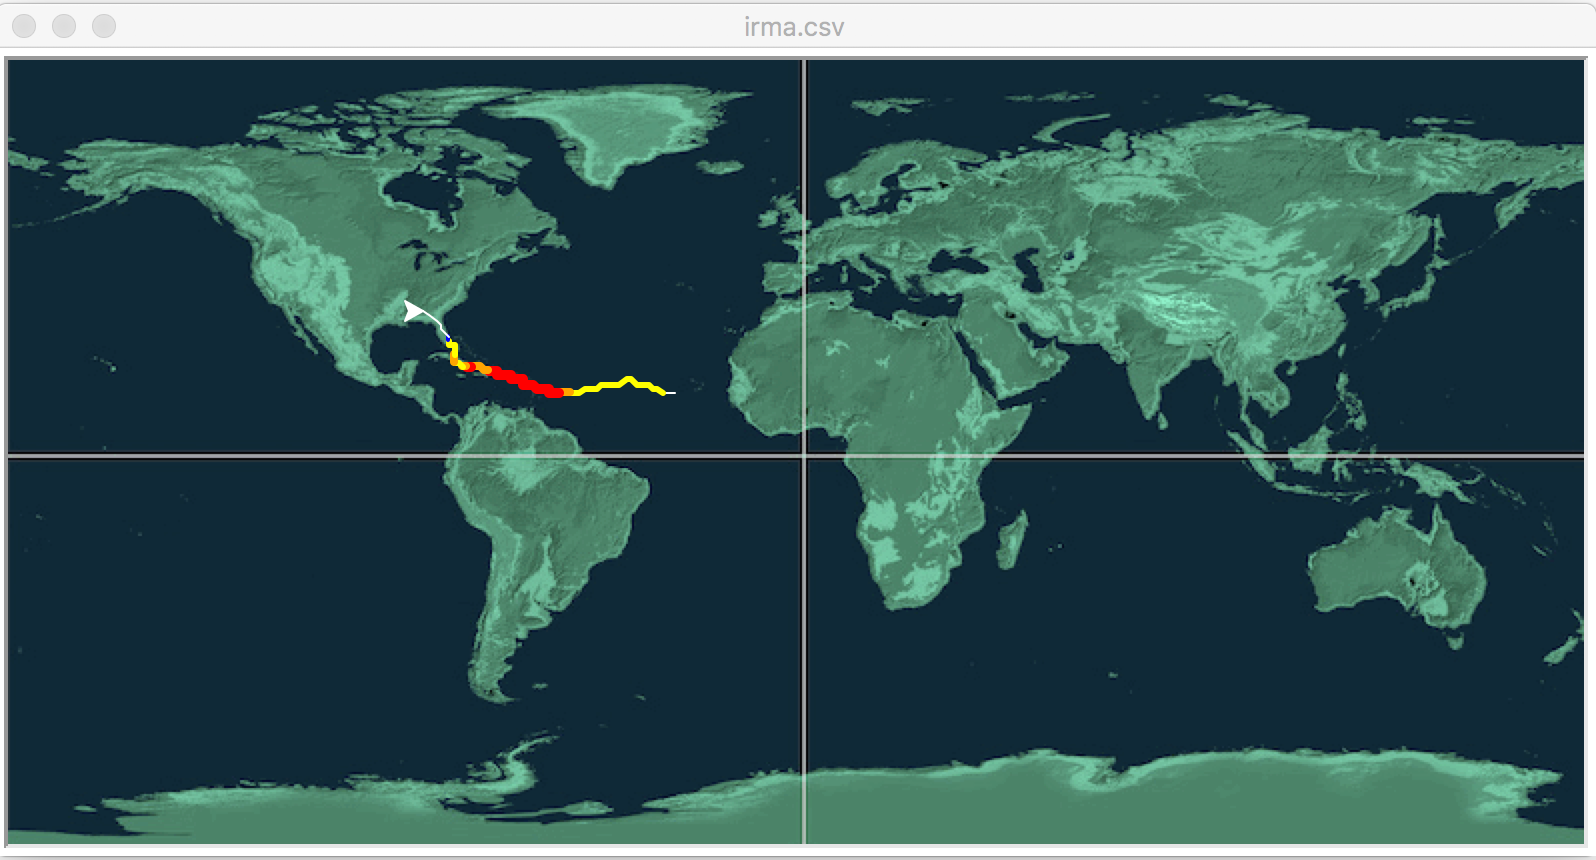
Fill in the missing function to animate hurricane data (inspired by the 2018 Nifty Hurricane Program by Phil Ventura).
Your function, animate(t,lat,lon,wind) takes as input:
- t: a turtle,
- lat: an integer storing the current latitude,
- lon: an integer storing the current longitude, and
- wind: the current wind speed in miles per hour.
Your function should move the turtle to the current location (longitude, latitude), and then based on the Saffir-Simpson Hurricane Wind Scale, change the turtle to be:
- red and pen size 5 for Category 5 (windspeed > 157 mph)
- orange and pen size 4 for Category 4 (windspeed in 130-156 mph)
- yellow and pen size 3 for Category 3 (windspeed in 111-129 mph)
- green and pen size 2 for Category 2 (windspeed in 96-110 mph)
- blue and pen size 1 for Category 1 (windspeed in 74-95 mph)
- white and pen size 1 if not hurricane strength
A template program, hurricane.py, and background image, mapNASA.gif, are available on the CSci 127 repo on github. The grading script does not run the whole program, but instead runs each of your functions separately ('unit tests') to determine correctness. As such, the names of the functions must match exactly the ones listed above (else, the scripts cannot find them).
Two test files (irma.csv and jose.csv) are from the Nifty site. Additional CSV files are available there.
Hint: You may find the following turtle commands useful: color(), goto(), and pensize().
- Due Date: 13 November Reading: Folium Tutorial & Lab 9
Write a program that uses folium to make a map of New York City. Your map should be centered at (40.75, -74.125) and include a marker for the main campus of Hunter College. The HTML file your program creates should be called: nycMap.html
Hint: See Lab 9.
- Due Date: 13 November
Reading: Folium Tutorial & Lab 9
Using folium (see Lab 9), write a program that asks the user for the name of a CSV file, name of the output file, and creates a map with markers for all the traffic collisions from the input file.
A sample run:
  Enter CSV file name:  collisionsThHunterBday.csv
  Enter output file:  thMap.html
which would produce the html file:
(The demo above is for October 18, 2016 using the time the collision occurred ("TIME") to label each marker and changed the underlying map with the option: tiles="Cartodb Positron" when creating the map.)
This assignment uses collision data collected and made publicly by New York City Open Data. A sample file, collisionsThHunterBday.csv from 18 October 2016 was downloaded and can be used to test your program.
Note: when creating datasets to test your program, you will need to filter for both date (to keep the files from being huge) and that there's a location entered. The former is explained above; to check the latter, add the additional filter condition of "LONGITUDE is not blank".
Hint: For this data set, the names of the columns are "LATITUDE" and "LONGITUDE" (unlike the previous map problem, where the data was stored with "Latitude" and "Longitude").
- Due Date: 16 November
Reading: Think CS: Chapter 3 & Lab 9
The program, errorsCircles.py, has lots of errors. Fix the errors and submit the modified program.
Hint: See Lab 9.
- Due Date: 16 November
Reading: Folium Tutorial & Lab 9
For this assignment, we will use folium again to generate a map with markers for textile drop-off locations in NYC.
The data is made publicly available by New York City Open Data. You can also obtain the data here: textileDropoff.csvUsing folium (see Lab 9), write a program that asks the user for the name of a CSV file, name of the output file, the name of a borough and creates a map with markers for all the textile drop-off locations in that borough from the input file.
To restrict the markers to a particular borough, make a copy of the dataframe after you groupby("Borough") and then get_group for the borough entered by the user. For example, if you named your dataframe df and stored the borough entered by the user in a variable named br, then you make a copy of the dataframe as: dfCopy = df.groupby("Borough").get_group(br)
Now your dataframe copy contains only textile drop-off locations for the borough specified by the user, and you can look at all the rows to extract "Latitude" and "Longitude" as you did in Lab 9 to place markers on the map. You can use the value in the "Address" column to name each marker.A sample run:
  Please enter the name of the input file: textileDropoff.csv
  Please enter the name of the output file: manhattan.html
  Please enter the name of the borough: Manhattan
which would produce the html file:
(The demo above uses the address of the drop-off location ("Address") to label each marker and changed the underlying map with the option: tiles="Stamen Watercolor" when creating the map.)
Lecture / Lab 10
- Due Date: 19 November Reading: Chapter 8, Lab 7 & Lab 10
Write a program that asks the user for a number and prints out the corresponding month. Your program will consist of two functions:
- main() is responsible for obtaining and validating the input and printing the output. In order to validate the input, it will repeatedly ask for a number until a valid number between 1 and 12 is entered.
- monthString() which returns the string corresponding to the number.
A template months.py is available on our github repo. You must fill in monthString() to implement its desired behavior and modify main() to vaildate the input.
A sample run of your program:
   Enter the number of the month: 15
   That is not a valid month number. Please enter a number between 1 and 12: 22
   That is not a valid month number. Please enter a number between 1 and 12: 12
   The month is December.
Hint: See Lab 10 for an example of validating the input.
- Due Date: 20 November Reading: Chapter 8 & Lab 10
Modify the program from Lab 10 to make a turtle walk 200 times: each "walk" is 5 steps forward and the turtle can turn 0, 30, 60, 90, ..., 360 degrees (chosen randomly) at the beginning of each walk.
A sample run of your program:

- Due Date: 20 November Reading: Ubuntu Terminal Reference Sheet & Lab 10
Write an Unix shell script that does the following:
- Creates two directories, programs and files.
- Creates 2 additional directories inside of programs (as subdirectories of programs ): python and c++.
- Creates 3 additional directories inside of files (as subdirectories of files ): pdf, csv and images.
- Due Date: 23 November Reading: Chapter 8, Lab 7 & Lab 10
Write a program that repeatedly asks the user for the price of a product, until the user enters a negative number to indicate there are no more prices to enter (sentinel value). The program should then return the total with 8.75% tax the user must pay for the items.
A sample run of your program:
  ------------------------------------------
  Welcome to the total with tax calculator!
  ------------------------------------------
  Please enter the price of each item you would like to purchase, one at a time.
  Enter a negative number when you are done.

  Enter the price of an item: 15.5
  Enter the price of an item: 89.99
  Enter the price of an item: 54
  Enter the price of an item: -1
  The total with tax is $173.445375
Hint: See Lab 4 for converting input to numbers
Lecture / Lab 11
- Due Date: 23 November
Reading: MIPS Wikibooks & Lab 11
Write a simplified machine language program that prints: I love MIPS!
See Lab 11 for details on submitting the simplified machine language programs.
Hint: You may find the following table useful:
(Image from wikimedia commons)Hint: The grading scripts are matching the phrase exactly, so, you need to include the spacing and punctuation.
- Due Date: 30 November Reading: MIPS Wikibooks& Lab 11
Write a simplified machine language program that has register $s0 loop through the numbers 0, 100, 200, ..., 500.
See Lab 11 for details on submitting the simplified machine language programs.
- Due Date: 30 November Reading:
Ubuntu Terminal Reference Sheet & Lab 10 & Lab 11.
Using Unix shell commands, write a script that counts the number of .py files in the current working directory.
Hint: See Lab 11.
Lecture / Lab 12
- Due Date: 30 November Reading: Cplusplus Tutorial & Lab 12
Write a C++ program that prints "Hello, World!" on one line and "Hello Hunter College!" on a new line.
The output of your program should be:
  Hello, World!
  Hello, Hunter College!
Hint: See Lab 12 for getting started with C++.
- Due Date: Due Date: 1 December Reading: Cplusplus Tutorial & Lab 12
Write a C++ program that will print "*** Hunter College ***" 16 times.
The output of your program should be:
  *** Hunter College ***
  *** Hunter College ***
  *** Hunter College ***
  *** Hunter College ***
  *** Hunter College ***
  *** Hunter College ***
  *** Hunter College ***
  *** Hunter College ***
  *** Hunter College ***
  *** Hunter College ***
  *** Hunter College ***
  *** Hunter College ***
  *** Hunter College ***
  *** Hunter College ***
  *** Hunter College ***
  *** Hunter College ***
Hint: See Lab 12 for getting started with C++.
- Due Date: 1 December Reading: Cplusplus Tutorial & Lab 12
Write a C++ program that converts degrees Celsius to degrees Fahrenheit. Your program should prompt the user for the degrees in Celsius and then print out the corresponding degrees Fahrenheit.
A useful formula: Fahrenheit = Celsius/5.0*9.0+32 .
IMPORTANT: For grading purposes, set the precision of Fahrenheit to one decimal place. To do so, add #include <iomanip> at the top of the file, and cout << fixed << setprecision(1); before outputting the value of Fahrenheit.
See Lab 4 for designing Input-Process-Output programs and Lab 12 for getting started with C++.
- Due Date: 3 December Reading: Cplusplus Tutorial & Lab 12
Write a C++ program program that asks the user for a number and draws an upside-down right triangle of that height and width using 'character graphics'.
A sample run:
  Please enter a number: 6

  * * * * * *
  * * * * *
  * * * *
  * * *
  * *
  *
Another sample run:
  Please enter a number: 3

  * * *
  * *
  *
Lecture / Lab 13
- Due Date: 4 December Reading: Cplusplus Tutorial & Lab 13
Write a C++ program that asks the user for the number of credits, and prints
- "Lower Freshman" if it is 15 or less
- "Upper Freshman" if it is greater than 15, but less than 28
- "Lower Sophomore" if it is between 28 and 45
- "Upper Sophomore" if it is more than 45 but less than 61
- "Lower Junior" if it is between 61 and 75
- "Upper Junior" if it is more than 75 but less than 94
- "Lower Senior" if it is between 94 and 108
- "Upper Senior" otherwise.
A sample run:
Enter number of credits:  15
Lower Freshman
Another sample run:
Enter number of credits:  78
Upper Junior
- Due Date: 4 December Reading: Cplusplus Tutorial & Lab 13
Write a C++ program that asks the user for an odd number, and continue asking until the number entered is odd.
A sample run:
  Please enter an odd number: 2
  You entered an even number.
  Please enter an odd number: 4
  You entered an even number.
  Please enter an odd number: -8
  You entered an even number.
  Please enter an odd number: 5
  Your odd number is: 5
Hint: This is similar to the age Python program from Lab 10, modify it and write it in C++.
- Due Date: 7 December Reading: Cplusplus Tutorial & Lab 13
Write a C++ program that asks the user for the starting amount, and prints out the yearly balance of a savings account, assuming 3% interest, until the amount has increased by more than $1000.
A sample run:
  Please enter the starting amount: 3000
  Year 1  3090.00
  Year 2  3182.70
  Year 3  3278.18
  Year 4  3376.53
  Year 5  3477.82
  Year 6  3582.16
  Year 7  3689.62
  Year 8  3800.31
  Year 9  3914.32
  Year 10 4031.75
Hint: Use an indefinite loop and continue looping while the balance is less than the initial amount + $1000.
Note: the autograder is expecting each line to begin with "Year " and the corresponding number for the year.
- Due Date: 7 December Reading: Cplusplus Tutorial & Lab 13
Write a C++ program that asks the user for a whole number between -31 and 31 and prints out the number in "two's complement" notation, using the following algorithm:
- Ask the user for a number, n.
- If the number is negative, print a 1 and let x = 32 + n.
- If the number is not negative, print a 0 and let x = n.
- Let b = 16.
- While b > 0.5:
- If x >= b then print 1, otherwise print 0
- Let x be the remainder of dividing x by b.
- Let b be b/2.
- Print a new line ('\n').
A sample run:
Enter a number:  8
001000
Another run:
Enter a number: -1
111111
Lecture / Lab 1
